Trading on the chart
See your positions and orders on the Original chart, edit them from there, and follow the economic calendar
Lines of your trades
Your positions and open orders appear on the Original chart as lines, each with a label against the price axis. They show when you are signed in, for the market you are on. The TradingView chart doesn't show them: trading from the chart is on the Original chart only.
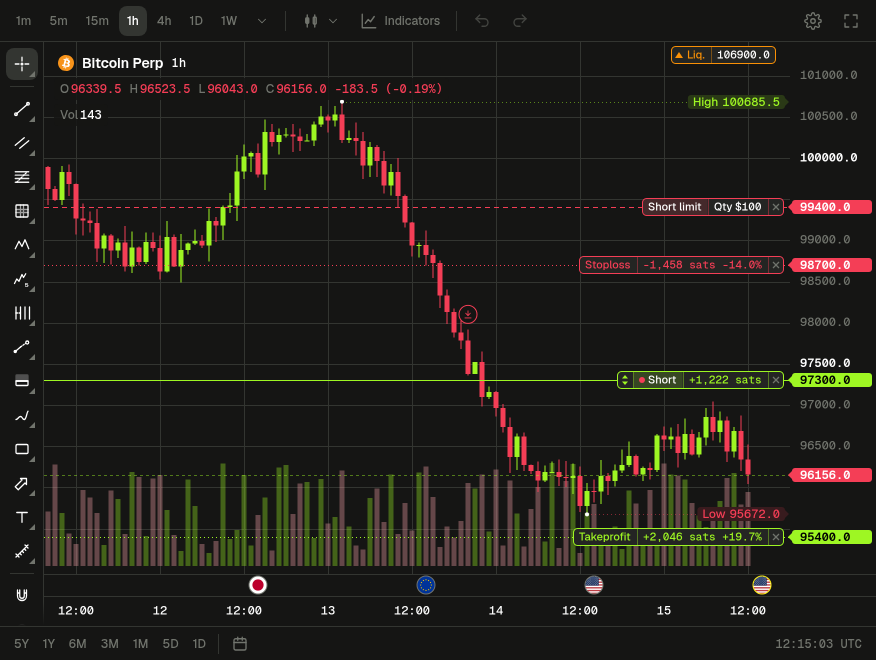
| Line | Style | Color | What it shows |
|---|---|---|---|
| Position | Solid | By P/L: green in profit, red at a loss, white at zero | The entry price of a running isolated trade, or of your cross position |
| Open order | Dashed | By side: green for a long, red for a short | The price of a pending isolated trade or a cross order, labeled Long limit or Short limit, with its quantity (Qty) |
| Takeprofit | Dotted | Green | A trade's takeprofit, with the P/L you would make there and its %. Also on a pending isolated trade |
| Stoploss | Dotted | Red | A trade's stoploss, with the P/L you would make there and its %. Reads Trailing stoploss when it trails. Also on a pending isolated trade |
| Liquidation | Dotted | Orange | The liquidation price, labeled Liq. |
These are the app's own green and red: they don't follow the Up color and Down color of Chart settings. A line appears only when it has a price, so a trade without a stoploss has no stoploss line.
The position label
An isolated position's label reads ↕ | • Long | P/L | ×. Some parts show only when you can edit from the chart:
| Part | What it is | Shows |
|---|---|---|
| Color stripe | The trade's own color | With several running isolated trades on the market (see below) |
↕ | The handle that pulls out a takeprofit or a stoploss | With Chart trading and Show takeprofit and stoploss on |
| • Long or Short | The side, its dot green for a long and red for a short | Always |
| P/L | Your live P/L, the same as in the Running table | Always |
| × | Closes the trade | With Chart trading on |
With Chart trading off, the label reads • Long | P/L. The line and the label follow the P/L, not the side.
Fill markers
On the bar where an isolated trade was filled, a circle with an arrow marks it: up and below for a long, down and above for a short, its ring green for a long and red for a short. It only marks the fill: clicking it does nothing.
Several trades
To hide a running isolated trade's marker and lines, turn off its switch in the Markers column of the Running trades table. This browser keeps your choice, also after a reload.
With several running isolated trades on a market, each has its own color: a thin stripe at the start of its labels (position, takeprofit, stoploss, Liq.) and the same stripe by its switch in the Markers column, so you can tell which lines are whose. A trade keeps its color for as long as it runs, even when others close; up to eight trades on a market each get a different one, the first ones far apart. Click a trade's stripe in the Markers column to pick another of the eight colors; only that trade changes, and this browser keeps it while the trade runs. Pending trades and cross lines have no stripe.
Click a position, or any of its lines, to pick out that trade: its position, takeprofit, stoploss and Liq. lines glow, the others stay as they are. Click an empty spot of the chart or press Esc to stop.
Editing from the chart
With Chart trading on:
- Move a takeprofit or stoploss: drag its line. It snaps to the market's tick size and takes the Down color where the price would be refused: dropped there, it goes back and a message says why. Press
Escto drop the drag. This works on pending isolated trades too. - Move a trailing stoploss: its line reads Trailing stoploss. Dropping it always asks first: Keep trailing, at the new distance from the price (picked by default), or Fix at the price you dropped it on, which stops the trailing; each is offered only where that stop can sit, and when only one can, the popup says which. While it asks, the line sits where the option you picked puts it.
- Add a takeprofit or stoploss: pull a new line out of the
↕handle of an isolated position. On a long, it is a takeprofit above the price the trade would close at now and a stoploss below it; the other way round for a short. If the trade already has one, this moves it. Dropped back where it started, nothing changes. - Move the liquidation further away: drag an isolated trade's Liq. line away from the price; its label shows the margin to add, in sats. On release you confirm the margin to add, the new leverage and the new liquidation. It can't go toward the price, and it turns the Down color where your balance or limits refuse it.
- Hover a line you can drag, or a handle: the line thickens and a hint says what dragging it does: Drag to move, Drag to set TP/SL or Drag to add margin.
- × on a takeprofit or stoploss removes it, on an open order cancels it, and on a position closes it. Click a line to select it, then
DeleteorBackspacedoes the same.
Guide lines while you drag
Once a line moves, thin dashed guide lines show how far it can go, each with a tag on the price axis:
| Tag | While you drag | Where |
|---|---|---|
| TP limit | A takeprofit | The closest a takeprofit can be: past the price the trade would close at, and past its liquidation |
| SL limit | A stoploss | The two ends a stoploss must stay between: the liquidation and the price the trade would close at |
| Current liq. | The Liq. line | Where the liquidation is now: the line can't go back past it |
| Max liq. | The Liq. line | The furthest your balance, a leverage of 1 or your account limits let it go, when one of them stops it |
On a pending trade, the trade's limit price stands in for the price it would close at. A guide line takes the Down color when the line you drag is past it. A guide line out of view pins its tag to the top or bottom edge, with an arrow and its price.
Confirming an edit
When Confirm chart edits is on, each edit asks first, in a popup under its label:
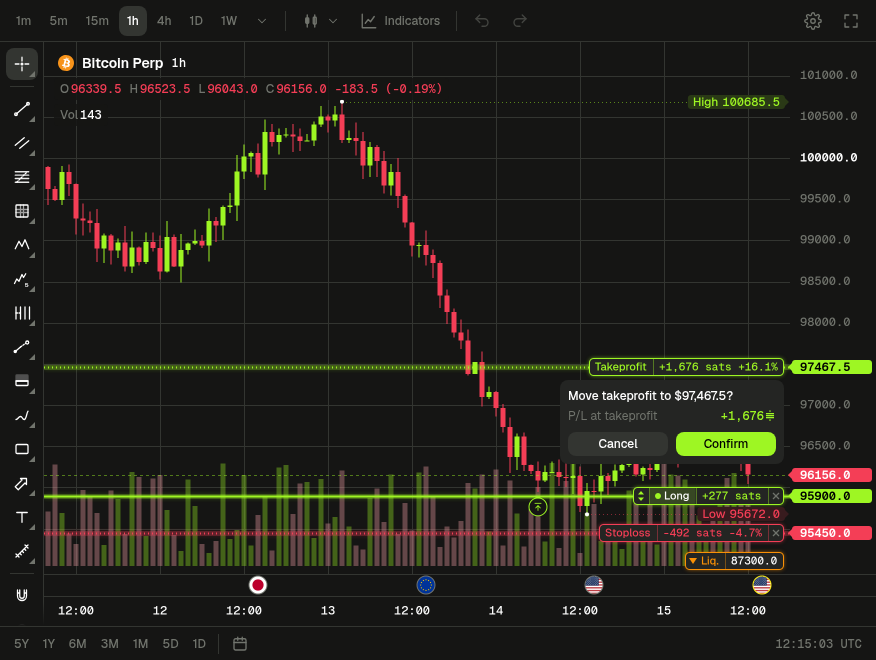
| Edit | The popup reads | It also shows |
|---|---|---|
| Move a takeprofit or stoploss | Move takeprofit to the price, or Move stoploss to the price | P/L at takeprofit or P/L at stoploss: what you would make there |
| Add one | Set takeprofit at the price, or Set stoploss at the price | P/L at takeprofit or P/L at stoploss |
| Move a trailing stoploss | Move trailing stoploss? | The Keep trailing / Fix at choice, and P/L at stoploss |
| Remove one | Remove takeprofit? or Remove stoploss? | |
| Cancel an order | Cancel this order? | |
| Move the liquidation | Add margin? | Margin to add, Updated leverage and Updated liquidation |
Confirm sends it; it is red when the edit removes or cancels. Cancel, Esc or a click elsewhere puts the line back. When Confirm chart edits is off, edits are sent at once. On a phone it is always on. Adding margin, moving a trailing stoploss and Delete or Backspace on a trade line always ask first.
Closing a position doesn't use this popup: × on a position, or Delete on its selected line, opens the Close trade dialog (Close position for your cross position), the same as in the trades tables. Confirm chart edits doesn't apply to it.
While an edit is sent
The line stays at its new price, faded, with a spinner in place of its ×, and takes no drag or click until the answer comes back. One edit is sent at a time: another drop meanwhile is not taken, and the line goes back. When it goes through, a message confirms it (Takeprofit updated, Stoploss updated, Margin added). When it fails, the line goes back and a message says why.
Cross positions and orders
Your cross position has one line at its entry price, • Long | P/L | ×, colored by its P/L, and its Liq. line. It has no color stripe and no ↕ handle, and neither line can be dragged: × opens the Close position dialog. Cross orders show as open order lines; × cancels one. Cross lines show only on markets that offer cross margin.
Lines out of view
A line above or below the visible prices pins its label to that edge, with an arrow and its price. Click the label to rescale the chart so the line is in view (this turns off Auto scale); you can then drag the line.
Hidden balances
When you hide your balances with the eye button of the app (Hide balances), the labels leave out the P/L, the quantity and the margin to add, and position lines turn white.
On a phone
Trade lines and fill markers show as on a computer. Drag a takeprofit or stoploss line with your finger to move it: on a phone, every edit asks first. Tapping a pinned label of a line out of view still brings the line into view.
Economic events sit over the bottom of the chart: tap a badge to read it.
Trading settings
In Chart settings → Trading, choose whether you can edit from the chart at all (Chart trading; off, the lines are for reading only), whether edits ask first (Confirm chart edits, grayed out while Chart trading is off, and always on for phones), which lines to show (Show positions, Show open orders, Show takeprofit and stoploss, Show liquidation) and Show economic events. They are all on by default. The tab applies when you click Validate, and this browser keeps it.
Economic events
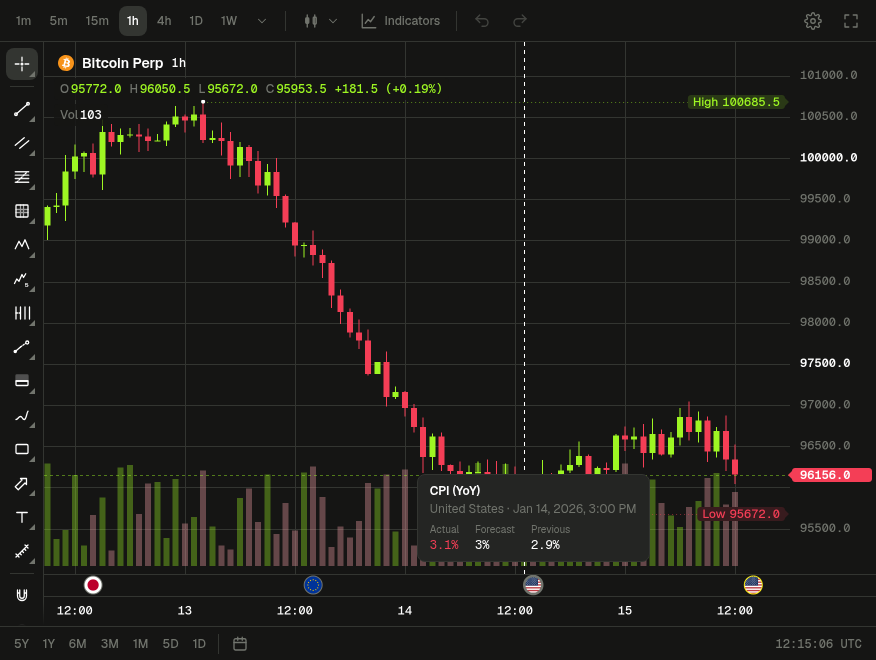
The Original chart marks the economic calendar's high-impact releases (US, euro area, Japan and China) in a row above its time axis: a round badge with the country's flag, over the candle of the release. Gray ones are past, back to the start of yesterday; yellow ones are coming up, up to a week ahead (zoom out to see the furthest ones). Badges too close together to tell apart merge into one, with the number of the others next to it (+2) when there is room. The row is there only while there are events to show.
The chart fetches the calendar again every 5 minutes. An upcoming event turns past, and its actual figure fills in, at the next fetch.
Hover a badge, or tap it on a phone, to read its events: the title, the country and the time in your device's time zone, then the Actual, Forecast and Previous figures of a past release, or the forecast, previous figure and time left of an upcoming one. The actual figure takes the chart's Up color when it is better than forecast, its Down color when worse (green and red unless you changed them in Chart settings → Symbol), and white when as expected. For unemployment, jobless claims, prices (CPI, PPI, PCE, inflation, import prices) and labor costs, lower is better; interest rate decisions stay white.
The News feed panel (under the chart on a phone's Markets page) lists every event of the calendar, also those the chart leaves out.
To hide them, turn off Show economic events in Chart settings → Trading. This browser keeps your choice. The TradingView chart doesn't show economic events.