Drawing tools
Draw lines, channels, Fibonacci and Gann tools, patterns, shapes, notes and measurements on the chart
The drawing toolbar
The column on the left of the chart groups the drawing tools. Each button shows the last tool you picked in its group. This is not saved: after a reload, every button shows the first tool of its group again. Click the button to use that tool, and click it again to go back to the cursor. A small triangle in a button's corner says its group has more tools: hover the button, or Tab to it, and click the arrow that shows on its right to see the whole group (or right-click the button, or long-press it on a touch screen). In the list, use ↑ and ↓ to move, and Enter or Space to pick.
| Group | Tools |
|---|---|
| Cursors | Cursor, Eraser |
| Lines | Trend Line, Ray, Info Line, Extended Line, Trend Angle, Horizontal Line, Horizontal Ray, Vertical Line, Cross Line, Arrow |
| Channels | Parallel Channel, Regression Trend, Flat Top/Bottom, Disjoint Channel, Pitchfork, Schiff Pitchfork, Modified Schiff Pitchfork, Inside Pitchfork |
| Fibonacci | Fib Retracement, Trend-Based Fib Extension, Fib Channel, Fib Time Zone, Trend-Based Fib Time, Fib Speed Resistance Fan, Fib Circles, Fib Speed Resistance Arcs, Fib Wedge, Fib Spiral |
| Gann | Gann Box, Gann Square Fixed, Gann Square, Gann Fan |
| Patterns | XABCD Pattern, Cypher Pattern, Head and Shoulders, ABCD Pattern, Triangle Pattern, Three Drives Pattern |
| Elliott | Elliott Impulse Wave (12345), Elliott Correction Wave (ABC), Elliott Triangle Wave (ABCDE), Elliott Double Combo Wave (WXY), Elliott Triple Combo Wave (WXYXZ) |
| Cycles | Cyclic Lines, Time Cycles, Sine Line |
| Projection | Forecast, Bar Pattern, Ghost Feed, Anchored VWAP, Fixed Range Volume Profile |
| Positions | Long Position, Short Position |
| Brushes | Brush, Highlighter |
| Shapes | Rectangle, Rotated Rectangle, Ellipse, Triangle, Path, Polyline, Arc, Curve, Double Curve |
| Markers | Arrow Marker, Arrow Mark Up, Arrow Mark Down, Arrow Mark Left, Arrow Mark Right, Flag Mark |
| Text & notes | Text, Anchored Text, Note, Anchored Note, Callout, Price Label, Price Note, Signpost |
| Measure | Measure, Price Range, Date Range, Date and Price Range |
Each tool is described in the tool reference at the end of this page.
Favorite tools. In a group's list, hover a tool and click its star (Add to favorites). Starred tools appear on a bar at the top of the chart (not on a phone), which moves under the style bar while a drawing is selected. Click a favorite to pick it, and again to go back to the cursor. Each market's layout keeps its own favorites. With the keyboard, press → on a tool to reach its star, then Enter or Space.
On a Mac, use ⌘ for Ctrl and ⌥ for Alt in the shortcuts on this page.
The bottom of the column holds Magnet, Stay in drawing mode, Lock all drawings, Hide drawings and Remove N drawings (see below).
On a phone, the drawing column is not shown. Tap the pen at the bottom left of the chart to open the drawing tools, pick one, then tap the chart to place its points. While a tool is picked the pen shows it: tap it to stop drawing.
Drawing
- Click once per point. A trend line takes two clicks, a horizontal line one and a pitchfork three. The tool reference gives the count for every tool. You can also press, drag and release to place the first two points.
- Path, Polyline and Ghost Feed take as many points as you like: double-click or press Enter to finish.
- Brush and Highlighter draw while you hold the button down.
- Draw by hand without picking a tool: with the cursor, press and hold still on the chart until the ring fills, then draw. A straight stroke becomes a Horizontal Line, a Vertical Line or a Trend Line; any other stays a Brush stroke. This works over a drawing or an order or position line too, except on their handles and labels. A plain drag still scrolls the chart, or moves the drawing or line under the pointer. On a touch screen, hold your finger still for about a third of a second, then draw; held still longer without drawing, it shows the crosshair instead.
- Text tools open a box after you place them: type, then press Enter. Esc drops what you typed. Text, Anchored Text and Callout are removed if you leave them empty. Double-click the text later to edit it.
- Anchored Text and Anchored Note stay at the same place on screen when you scroll.
- Anchored VWAP starts at the candle you click, with bands above and below. Its value at the last candle on screen shows on the price axis.
- Bar Pattern takes three clicks: two pick the bars to copy, the third places the copy. Ghost Feed draws made-up candles along the points you click. Both are picked by their candles: a click between them goes to the chart once you zoom in far enough to see a gap between them.
- Hold Shift while you place the second point of a Trend Line, Ray, Info Line, Extended Line, Trend Angle or Arrow, or drag one of its ends, to keep it level, upright or at 45°. With Rectangle and Ellipse, Shift draws a square or a circle.
- Press Esc to stop placing a drawing.
After each drawing the chart goes back to the cursor. To draw several in a row, turn on Stay in drawing mode at the bottom of the column.
Magnet. The magnet button at the bottom of the column snaps points to a candle's open, high, low or close. Click it to cycle between off, weak (snaps when you are close) and strong (always snaps). It works on the price pane.
Measuring
Hold Shift and drag across the chart to measure a move: the price change and its percentage, the number of bars and the time they span, and the volume traded. The measure disappears on your next click. The Measure tool does the same in two clicks.
To keep a measurement on the chart, use Price Range (the price change), Date Range (the bars, the time and the volume) or Date and Price Range (all three).
Long and Short Position
Long Position and Short Position draw a risk/reward box: click the entry, then the target. The stop starts at half the target distance on the other side. Drag any of the three points to adjust it: the stop moves only up and down, and stays at the target's time. The labels show the target and stop prices with their percentages, and the side, the entry price and the risk/reward ratio (R:R).
The two tools draw the same box. Only their starting color differs. The box reads Long when the target is above the entry and Short when it is below, whichever of the two tools you used. The target and stop zones always use the chart's up and down colors: the drawing's color only changes the outline of its handles.
These tools are for planning only. They have no quantity or risk inputs, and they do not place orders.
Editing a drawing
Click a drawing to select it. Rectangle, Rotated Rectangle, Ellipse, Triangle, Polyline and Arc are selected by their outline: inside them, a click or a drag goes to the chart until the shape is selected, and then dragging from inside moves it. Channels (except pitchforks), the Fibonacci and Gann tools with bands (not Gann Fan), the positions, the range tools and Fixed Range Volume Profile can be picked anywhere inside. Then:
- Drag it to move it, or drag one of its points to reshape it.
- Press the arrow keys to move it: ↑ and ↓ by one pixel, ← and → by one bar (one pixel for Anchored Text and Anchored Note). Hold Shift to move ten times as far.
- Use the style bar at the top of the chart to change its look (see below), lock it, open its settings, edit its levels (see Edit levels) or remove it.
- Double-click it to open its settings (see Drawing settings). On a text drawing, double-click edits the text instead: open its settings from the style bar. A locked text drawing opens its settings on double-click.
- Press Delete or Backspace to remove it.
Style bar
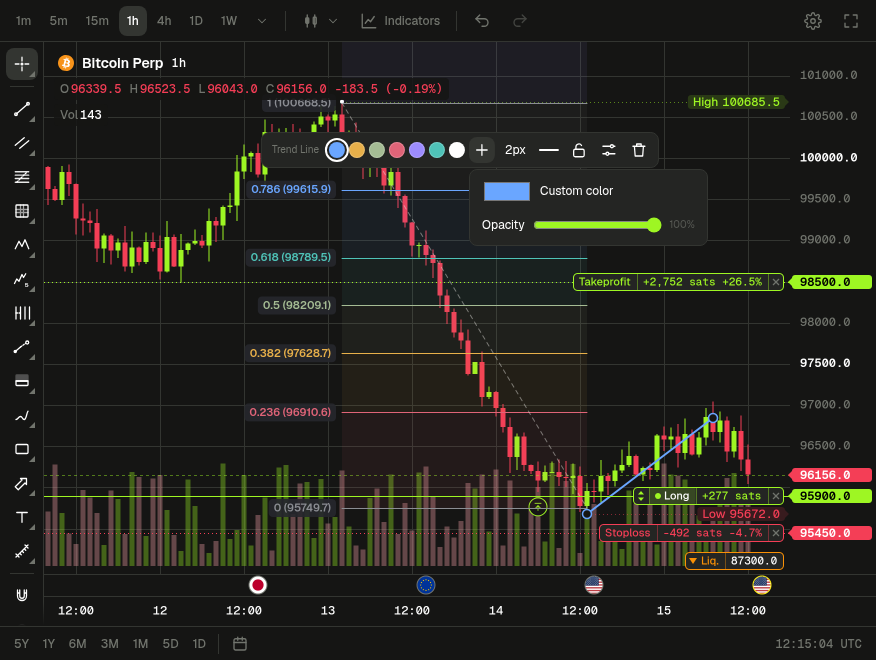
The bar starts with the drawing's name. The color dots set the drawing's color. + opens Custom color and Opacity. Depending on the tool, the bar also has:
- Text color, on Callout, Note, Anchored Note, Signpost, Price Note and Arrow Marker.
- Background, on shapes (Rectangle, Rotated Rectangle, Ellipse, Triangle, Arc, Polyline): the fill color and opacity, or no fill.
- Line width: 1 to 4 px, 2 px for a new drawing. Not on tools drawn at a width of their own: the Fibonacci tools (except Fib Wedge and Fib Spiral), the Gann tools, Cyclic Lines, the positions, Bar Pattern, Ghost Feed, Anchored VWAP, Fixed Range Volume Profile, Highlighter and the range tools.
- Line style: Solid line, Dashed line or Dotted line. Not on Forecast, which keeps its dashes.
- Edit levels, on the tools listed under Edit levels, unless the drawing is locked.
Text, Anchored Text, Note, Anchored Note, Price Label and the markers have no line, so no Line width or Line style. The bar ends with lock and Settings, then Edit levels on the level tools, then remove.
On Fib Retracement, Trend-Based Fib Extension, Fib Channel, Fib Time Zone, Trend-Based Fib Time, Fib Speed Resistance Fan, Fib Circles, Fib Speed Resistance Arcs and Fib Wedge, and on the grids of the Gann tools, each level has a fixed color set by its value (0.618 is always the same color, in every tool; a custom level takes its color from its place in the list). The color dots don't recolor these levels. They color the rest of the drawing: its handles, the first line of Fib Time Zone, the sides of Fib Wedge, the frame of the Gann tools, the diagonals of Gann Box, the fans and arcs of Gann Square and Gann Square Fixed, and the 1/1 ray of Gann Fan.
Right-click menu
Right-click a drawing for Bring to front and Send to back, Clone, Copy, Lock, Hide, Remove and Settings….
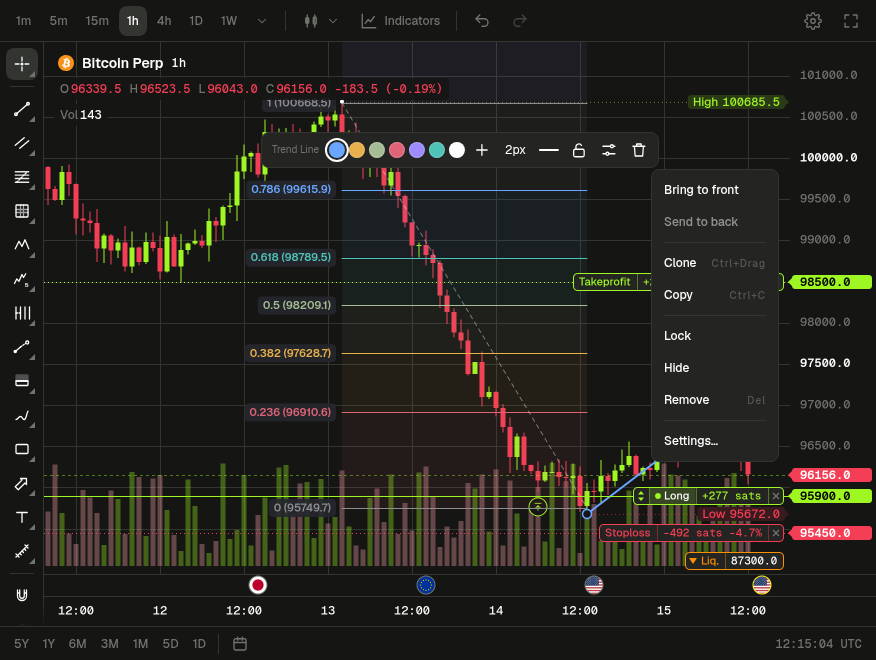
- Clone adds a copy just above the drawing. You can also hold Ctrl (⌘ on a Mac) and drag a drawing: the copy goes where you drop it.
- Copy (
Ctrl+C) keeps the drawing. Paste it withCtrl+V, or Paste in the chart's right-click menu. Each paste lands just above where you copied it, on the same pane. - Hide hides one drawing. To bring hidden drawings back, right-click the chart and pick Show N hidden drawings. Hidden drawings stay hidden after a reload.
Several drawings
Hold Ctrl (⌘ on a Mac) and click drawings to select several. Dragging one moves them all. The arrow keys, Delete, Copy, and the menu's Clone, Lock, Hide and Remove act on all of them. The style bar and the settings change the drawing you clicked last.
Lock, hide and remove all
A locked drawing can't be dragged, moved with the arrows, erased or deleted until you unlock it. You can still change it from its settings and the style bar, except its levels.
The bottom of the column also has buttons that act on every drawing: Lock all drawings, Hide drawings (Ctrl+Alt+H) and Remove N drawings. Remove N drawings removes every drawing that is not locked, hidden ones included: N counts them.
Drawings hidden with Hide drawings can't be selected or erased. They come back when you click the button again, reload the page, or add a drawing: placing one, cloning, pasting, or drawing a line at the pointer with Alt+H, Alt+J, Alt+V or Alt+C.
Eraser
Pick Eraser in the Cursors group, then click a drawing to remove it, one drawing per click. The pointer turns into an eraser over a drawing you can erase. The Eraser stays on until you press Esc or pick another tool. A locked drawing is not erased: a message asks you to unlock it first. Each erased drawing is one step for Undo.
Edit levels
Fibonacci, Gann and pitchfork tools draw lines at levels. On these tools, the style bar has Edit levels: it turns the bar into a Levels box. Type the levels as numbers separated by commas or spaces, then press Enter, or click elsewhere, to keep them. Esc keeps the old levels. The chart sorts the levels and drops duplicates. Leave the box empty to go back to the tool's default levels.
| Tool | Default levels |
|---|---|
| Fib Retracement, Fib Channel | 0, 0.236, 0.382, 0.5, 0.618, 0.786, 1, 1.618 |
| Trend-Based Fib Extension | 0, 0.618, 1, 1.618, 2.618 |
| Trend-Based Fib Time | 0, 0.382, 0.5, 0.618, 1, 1.382, 1.618, 2, 2.618, 3, 3.618, 4.236 |
| Fib Speed Resistance Fan, Gann Box, Gann Square Fixed, Gann Square | 0, 0.25, 0.382, 0.5, 0.618, 0.75, 1 |
| Fib Circles | 0.236, 0.382, 0.5, 0.618, 0.786, 1, 1.618, 2.618 |
| Fib Speed Resistance Arcs, Fib Wedge | 0.236, 0.382, 0.5, 0.618, 0.786, 1 |
| Pitchfork, Schiff Pitchfork, Modified Schiff Pitchfork, Inside Pitchfork | 0.5, 1 |
A pitchfork draws each level on both sides of its median line, so 0.5 and 1 give four lines plus the median. It uses only levels above 0. Fib Circles skips levels of 0 or below.
Three tools have fixed levels and no Edit levels: Fib Time Zone (lines at 0, 1, 2, 3, 5, 8, 13, 21, 34, 55, 89, 144, 233 and 377 times the first span), Fib Spiral and Gann Fan (rays at 1/8, 1/4, 1/3, 1/2, 1/1, 2/1, 3/1, 4/1 and 8/1).
Level colors are fixed (see Style bar): there is no per-level color or on/off switch.
Drawing settings
Open a drawing's settings with a double-click (from the style bar on a text drawing), the style bar's Settings button, or Settings… in its right-click menu. The settings have up to four tabs, depending on the tool:
| Tab | Tools | Settings |
|---|---|---|
| Style | Every tool except Text and Anchored Text | Line (Color on tools without a line): color, opacity, width and style, as on the style bar; Background on shapes; and on a trend line Extend left, Extend right and Show stats |
| Text | Text, Anchored Text, Note, Anchored Note, Callout, Price Note, Signpost and Arrow Marker; Trend Line, Ray, Extended Line, Horizontal Line, Horizontal Ray, Vertical Line and Rectangle | Text, Text color, Font size, Bold and Italic, plus Vertical text alignment and Horizontal text alignment on the lines and the rectangle |
| Coordinates | Every tool except Anchored Text, Anchored Note and drawings of more than 8 points, such as brush strokes | The price and time of each point (only the price on a horizontal line, only the time on a vertical line), in the chart's time zone (UTC on 1D and longer) |
| Visibility | Every tool | The timeframes the drawing shows on |
Text and Anchored Text have no Style tab: their color is on Text. Info Line, Trend Angle, Cross Line, Arrow and Price Label have no Text tab. Extend left and Extend right run a trend line to the edge of the chart, and Show stats shows its price change, number of bars, duration and angle. On a position, the stop has only a price: it shares the target's time.
Changes preview live. OK (or Enter in a field) keeps them, as one step for Undo; Cancel, Esc or a click outside the dialog drops them. Remove, next to the close button, deletes the drawing, unless it is locked. To lock a drawing, use the style bar or the right-click menu.
Text on lines
Trend Line, Ray, Extended Line, Horizontal Line, Horizontal Ray, Vertical Line and Rectangle can carry a text: type it on their Text tab. It is written along the line, on one line, in the drawing's color unless you pick a Text color. Two settings place it:
- Vertical text alignment sets the side: Top (above the line), Middle (across the line, which breaks around the text) or Bottom. On a rectangle, Top, Inside or Bottom. By default the text is above trend lines, rays and extended lines, across horizontal and vertical lines, below a horizontal ray and inside a rectangle.
- Horizontal text alignment sets the place along it: Left, Center (the default) or Right.
A vertical line's text reads upwards. Clicking the text selects the drawing.
Text style
Font size, Bold and Italic work on every tool with a Text tab. Font size is a list: 8, 10, 11, 12, 14, 16, 18, 20, 22, 24, 28, 32 and 40 px, plus 13 px on Text and Anchored Text. By default, text is 14 px on trend lines, rays, extended and vertical lines and the rectangle, 13 px on Text and Anchored Text, 11 px on Price Note, and 12 px on horizontal lines and rays and the other text tools.
Visibility
Each unit has a box and a range: Seconds (1 to 59), Minutes (1 to 59), Hours (1 to 24), Days (1 to 366), Weeks (1 to 52) and Months (1 to 12). The drawing shows only on timeframes whose unit is ticked and within the range. Every timeframe is ticked to begin with.
Each timeframe counts in one unit: 1m to 45m in Minutes, 1h to 4h in Hours, 1D in Days (1), 1W in Weeks (1), and 1M and 3M in Months (1 and 3). For example, untick Minutes to keep a drawing off 1m to 45m, set Hours from 2 to 24 to keep it off 1h, or untick Days to keep it off 1D. Seconds has no effect: the chart has no timeframe under a minute.
A drawing out of the current timeframe can't be selected, and comes back when you switch to a timeframe it shows on.
Drawings on indicator panes
You can draw on an indicator's pane as on the price chart: the drawing stays on the pane you place it on. Its points are values on that pane's scale, not prices: a Horizontal Line at 70 on an RSI pane stays at 70. The Coordinates tab shows these values as they are, without the market's price decimals.
- The magnet works only on the price pane.
- Tools that read candles need the price chart. On an indicator pane, Regression Trend, Bar Pattern and Fixed Range Volume Profile draw only a line between their points, Anchored VWAP draws a dot, and a Forecast stays In progress.
- A drawing moves with its pane when you move the pane up or down. A collapsed pane shows none of its drawings, and you can't draw on it.
- Copies and pastes land on the same pane.
- Deleting a pane, or removing the last indicator on it, also removes the drawings on it. Undo brings both back.
Tool reference
Every tool can be placed with clicks, one per point. Tools with two or more points can also be dragged out: press on the first point and release on the second. "Shift" in the notes means Shift keeps the line level, upright or at 45° (or the shape square). Tools not listed under Edit levels have no Edit levels.
Cursors
| Tool | What it does | Points | Notes |
|---|---|---|---|
| Cursor | Selects, moves and edits drawings; press and hold to draw by hand | none | Esc goes back to it |
| Eraser | Removes the drawing you click, one per click | none | Stays on until Esc; skips locked drawings |
Lines
| Tool | What it draws | Points | Notes |
|---|---|---|---|
| Trend Line | A line between two points | 2 | Shift; Text tab; Extend left, Extend right, Show stats; Alt+T |
| Ray | A line from the first point through the second, to the edge of the chart | 2 | Shift; Text tab |
| Info Line | A line with a card: price change and percentage, bars and time, angle | 2 | Shift |
| Extended Line | A line through both points, to both edges of the chart | 2 | Shift; Text tab |
| Trend Angle | A line with a dashed level base and its angle in degrees | 2 | Shift |
| Horizontal Line | A level across the whole chart | 1 | Text tab; price only in Coordinates; Alt+H draws one at the pointer |
| Horizontal Ray | A level from the point to the right edge | 1 | Text tab; Alt+J draws one at the pointer |
| Vertical Line | A line at one time, across the pane | 1 | Text tab, read upwards; time only in Coordinates; Alt+V draws one at the pointer |
| Cross Line | A horizontal and a vertical line crossing at the point | 1 | Alt+C draws one at the pointer |
| Arrow | A line with an arrowhead on the second point | 2 | Shift |
Channels
| Tool | What it draws | Points | Notes |
|---|---|---|---|
| Parallel Channel | A line, a parallel line through the third point, the band between them and a dashed middle line | 3 | Picked inside |
| Regression Trend | The regression line of the closes between the two bars, bands at 2 standard deviations, and its correlation r | 2 | Picked inside; needs the price chart |
| Flat Top/Bottom | A line and a flat line at the third point's price, over the same span, with the band between them | 3 | Picked inside |
| Disjoint Channel | A line and a line of opposite slope from the third point, with the band between them | 3 | Picked inside |
| Pitchfork | A median line from the first point through the middle of the other two, with parallel lines through them | 3 | Edit levels (0.5, 1) |
| Schiff Pitchfork | A pitchfork whose median starts halfway, in price, between the first and second points | 3 | Edit levels (0.5, 1) |
| Modified Schiff Pitchfork | A pitchfork whose median starts halfway between the first and second points, in time and in price | 3 | Edit levels (0.5, 1) |
| Inside Pitchfork | A pitchfork whose median runs from halfway between the first two points to the third; its outer lines pass through the second point and its mirror across the third | 3 | Edit levels (0.5, 1) |
Fibonacci
| Tool | What it draws | Points | Notes |
|---|---|---|---|
| Fib Retracement | Price levels between the two points, each labeled with its level and price | 2 | Edit levels; picked inside; Alt+F |
| Trend-Based Fib Extension | The move from the first to the second point, projected from the third point at each level | 3 | Edit levels |
| Fib Channel | Lines parallel to the first two points, spaced by the distance to the third | 3 | Edit levels; picked inside |
| Fib Time Zone | Vertical lines at Fibonacci multiples of the span between the two points | 2 | Fixed levels |
| Trend-Based Fib Time | Vertical lines from the third point, at each level of the time from the first to the second | 3 | Edit levels |
| Fib Speed Resistance Fan | Rays from the first point to each level, in price and in time | 2 | Edit levels; picked inside |
| Fib Circles | Circles around the middle of the two points, one per level | 2 | Edit levels |
| Fib Speed Resistance Arcs | Half circles around the first point, one per level of the distance to the second | 2 | Edit levels |
| Fib Wedge | Two sides from the first point, with arcs between them at each level | 3 | Edit levels; picked inside |
| Fib Spiral | A golden spiral from the two points, with a dashed axis | 2 | No levels |
Gann
| Tool | What it draws | Points | Notes |
|---|---|---|---|
| Gann Box | A box with level lines across and down, and dashed diagonals | 2 | Edit levels; picked inside |
| Gann Square Fixed | A Gann Square kept square on screen, so its 1/1 line is always at 45° | 2 | Edit levels; picked inside |
| Gann Square | A box with level lines, and fans and arcs from the first corner | 2 | Edit levels; picked inside |
| Gann Fan | Nine labeled rays from the first point, from 1/8 to 8/1 | 2 | Fixed rays |
Patterns
| Tool | What it draws | Points | Notes |
|---|---|---|---|
| XABCD Pattern | Legs X, A, B, C, D, with dashed ratio lines and their ratios | 5 | |
| Cypher Pattern | The same legs as XABCD, with the Cypher pattern's ratios | 5 | |
| Head and Shoulders | Seven points, a neckline, and the labels Left Shoulder, Head and Right Shoulder | 7 | |
| ABCD Pattern | Legs A, B, C, D with their ratios | 4 | |
| Triangle Pattern | Points A to D, with sides A–C and B–D, run on to where they meet when that point is just ahead | 4 | |
| Three Drives Pattern | Drives 1, 2 and 3 with corrections A and B, and their ratios | 6 |
Elliott
| Tool | What it draws | Points | Notes |
|---|---|---|---|
| Elliott Impulse Wave (12345) | A wave labeled (0) to (5) | 6 | |
| Elliott Correction Wave (ABC) | A wave labeled (0), (A), (B), (C) | 4 | |
| Elliott Triangle Wave (ABCDE) | A wave labeled (0) to (E) | 6 | |
| Elliott Double Combo Wave (WXY) | A wave labeled (0), (W), (X), (Y) | 4 | |
| Elliott Triple Combo Wave (WXYXZ) | A wave labeled (0), (W), (X), (Y), (X), (Z) | 6 |
Cycles
| Tool | What it draws | Points | Notes |
|---|---|---|---|
| Cyclic Lines | Vertical lines repeated at the span between the two points, from the earlier point to the right | 2 | |
| Time Cycles | Half ellipses repeated at the span between the two points, every other one shaded | 2 | |
| Sine Line | A sine wave through a top and the next bottom (or the reverse), across the chart | 2 |
Projection
| Tool | What it draws | Points | Notes |
|---|---|---|---|
| Forecast | A dashed arrow to a target, with a card: price change, bars and date, and In progress, Success or Failure | 2 | Success once a later candle reaches the target price, up to the target's time; the card then turns to the up or down color |
| Bar Pattern | A copy of the candles between the first two points, placed at the third | 3 | Picked by its candles; needs the price chart |
| Ghost Feed | Made-up candles along the points you click | 2 or more | Double-click or Enter to finish; picked by its candles |
| Anchored VWAP | The volume-weighted average price from the candle you click, with bands above and below | 1 | Its value shows on the price axis; needs the price chart |
| Fixed Range Volume Profile | The volume traded at each price between the two bars, in 24 rows split into up and down volume, with the point of control (POC) and the value area | 2 | Picked inside; needs the price chart |
Positions
| Tool | What it draws | Points | Notes |
|---|---|---|---|
| Long Position | A risk/reward box with entry, target and stop | 2 | Stop placed for you; same box as Short Position |
| Short Position | The same box as Long Position | 2 | Label follows the target, not the tool |
Brushes
| Tool | What it draws | Points | Notes |
|---|---|---|---|
| Brush | A free stroke | Hold the button down | Width and style |
| Highlighter | A wide, see-through stroke | Hold the button down | Fixed width |
Shapes
| Tool | What it draws | Points | Notes |
|---|---|---|---|
| Rectangle | A box between two corners | 2 | Shift: square; Background; Text tab; Alt+Shift+R |
| Rotated Rectangle | A box along the line of the first two points, as wide as the third is far | 3 | Background |
| Ellipse | An ellipse in the box between two corners | 2 | Shift: circle; Background |
| Triangle | A triangle on three corners | 3 | Background |
| Path | An open line through every point | 2 or more | Double-click or Enter to finish |
| Polyline | A closed shape through every point | 2 or more | Double-click or Enter to finish; Background |
| Arc | An arc from the first point to the second, through the third | 3 | Background |
| Curve | A curve from the first point to the second, bent through the third | 3 | |
| Double Curve | An S-curve from the first point to the second, bent by the third | 3 |
Markers
| Tool | What it draws | Points | Notes |
|---|---|---|---|
| Arrow Marker | A thick arrow from the first point to the second, with an optional text | 2 | Text box opens after placing; Text color; Text tab |
| Arrow Mark Up | A small arrow pointing up | 1 | Color only |
| Arrow Mark Down | A small arrow pointing down | 1 | Color only |
| Arrow Mark Left | A small arrow pointing left | 1 | Color only |
| Arrow Mark Right | A small arrow pointing right | 1 | Color only |
| Flag Mark | A small flag | 1 | Color only |
Text & notes
| Tool | What it draws | Points | Notes |
|---|---|---|---|
| Text | A text | 1 | Removed if left empty; no Style tab |
| Anchored Text | A text that stays at the same place on screen | 1 | Removed if left empty; no Style or Coordinates tab |
| Note | A note card on a pin | 1 | Text color |
| Anchored Note | A note card that stays at the same place on screen | 1 | Text color; no Coordinates tab |
| Callout | A bubble with your text, pointing at the first point | 2 | Removed if left empty; Text color |
| Price Label | A tag showing the price at the point | 1 | No text of your own; color only |
| Price Note | A bubble with your text and the price at the first point | 2 | Text color |
| Signpost | A sign with your text on a pole that reaches down or up to the candle | 1 | Text color |
Measure
| Tool | What it draws | Points | Notes |
|---|---|---|---|
| Measure | Price change and percentage, bars and time, and volume | 2 | Gone on your next click; same as Shift+drag |
| Price Range | A box with the price change and percentage | 2 | Picked inside; turns to the down color when the price falls |
| Date Range | A box with the bars, the time and the volume | 2 | Picked inside |
| Date and Price Range | A box with the price change, the bars, the time and the volume | 2 | Picked inside; turns to the down color when the price falls |