Indicators
Add, set up and arrange the chart's 106 indicators, with every indicator's inputs, lines and levels
Adding an indicator
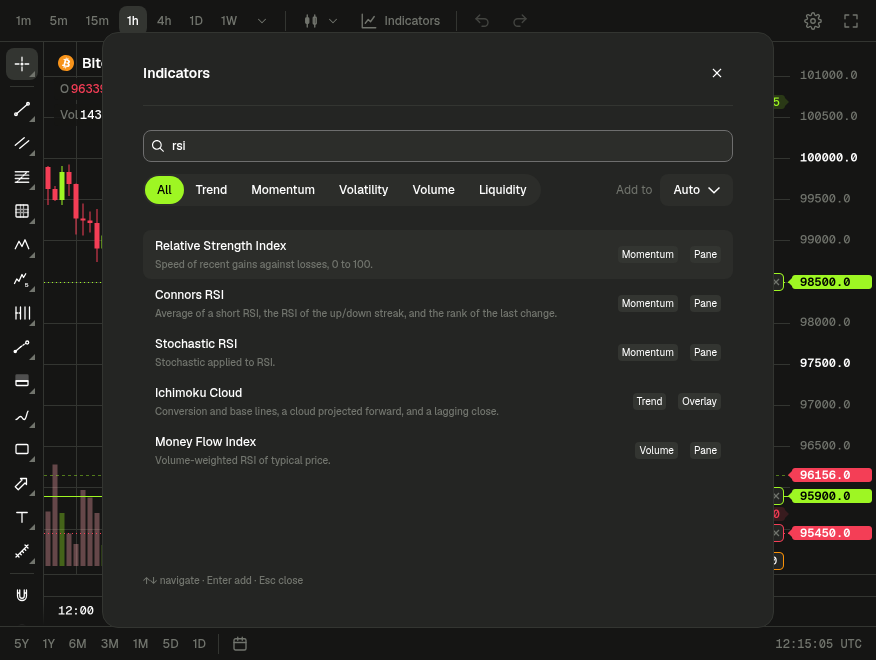
- Click Indicators in the top bar, press
/, or right-click the chart and pick Add indicator…. - Type in Search indicators, or pick a filter: All (the default), Trend, Momentum, Volatility, Volume or Liquidity. The search and the filter work together.
- Click an indicator (or its Add button), or select it with the arrow keys and press Enter.
The search matches the name, the short name shown in the legend (like MA or BB), the description and the indicator's id (sma finds Moving Average). The best match comes first: an exact id or short name, then names that start with what you typed, then any other mention. So typing rsi and pressing Enter adds the Relative Strength Index. With the search empty, the list is in alphabetical order.
Each row shows the indicator's name, a one-line description, its category and Overlay or Pane. Indicators marked Overlay draw over the candles. Those marked Pane get their own pane below the chart. An indicator already on the chart shows On chart, or On chart ×2 and so on: you can add the same one as many times as you like.
The arrow keys wrap around the list. The dialog stays open so you can add several: close it with Esc, its close button or a click outside when you are done. Each indicator you add is one Undo step.
Add to chooses where the next indicator goes:
| Option | Where it goes |
|---|---|
| Auto (default) | An Overlay on the price chart, a Pane indicator in a new pane at the bottom |
| New pane | A new pane at the bottom, whatever the kind |
| Price chart or another pane | That pane, whatever the kind. A pane is named after the indicators in it, joined with + (for example RSI 14 close + MACD 12 26 9 close) |
If the pane you picked goes away, Add to goes back to Auto.
There are 106 indicators, including moving averages, VWAP, Bollinger Bands, RSI, MACD, Stochastic, Ichimoku Cloud, Supertrend, volume profiles and a Liquidation Heatmap (model). It is an estimate of where liquidations cluster, built from volume and common leverage levels. It is not exchange data. See the reference below.
Managing an indicator
Each indicator has a row in the legend. Hover the row (tap it on a touch screen) to show its buttons:
- Hide / Show: hide the indicator without removing it.
- Settings: open its settings. You can also double-click the row.
- More: the indicator's menu. Right-clicking the row opens it too.
- Remove: delete the indicator.
The legend row shows the indicator's short name followed by its inputs, for example RSI 14 close (see Legend labels).
The More menu
| Item | What it does |
|---|---|
| Settings… | Opens the settings |
| Visual order | Bring to front, Send to back, Bring forward and Send backward among the lines of its pane. The ones that cannot move it further are grayed out |
| Move to | New pane above, New pane below, then every pane by name, with the current one ticked. New pane above is grayed out on the price chart. Both are grayed out when the indicator is alone in an indicator pane, which is a pane of its own already |
| Pin to scale | Pinned to right scale, Pinned to left scale or No scale (fullscreen): see below |
| Clone | Adds a copy, with the same inputs, colors, style and legend name, in the same pane |
| Copy | Copies the indicator as it is now. Ctrl+V (⌘V on a Mac) or Paste in the chart's right-click menu adds it again, where a new one of its kind goes (the Auto placement above) |
| Hide / Show | Hides or shows it |
| Remove | Deletes it |
Each change from this menu is one Undo step.
Pin to scale. Pinned to right scale shares the pane's price axis. Pinned to left scale puts the indicator on a second axis on the other side, which you drag to scale it on its own (double-click it to fit it again). No scale (fullscreen) scales the indicator on its own, over the full height of the pane. With the price scale on the left, Pinned to left scale is the one that shares the pane's axis.
Pin to scale shows only when another line in the pane is scaled with the indicator:
- On the price chart: always, since the candles share the price axis.
- In an indicator pane: when another indicator there keeps the pane's axis, or when this one already has a scale of its own. An indicator built on this one (through its Source) does not count, since it moves with it.
- Never for Previous Highs & Lows and the Liquidation Heatmap (model): they leave the price scale fitted to the candles.
Scaling one indicator of several in a pane
In an indicator pane, click an indicator's line or its name in the legend to give it the pane's price axis: its name shows at the top of the axis, and dragging, scrolling over or double-clicking the axis scales that indicator only. The pointer turns into a hand over a line you can click. The scale you set for each indicator is saved with the layout. Click an empty spot of the chart to give the axis back. The price chart's axis always scales the prices. TradingView does this with Pin to scale, which works here too.
A Pane indicator you add to a pane that already has lines gets a scale of its own, so an RSI keeps its 0 to 100 shape on top of a MACD. An Overlay added to the price chart shares the price scale.
Building on another indicator
To build an indicator on another one, for example a moving average of the RSI, pick the other indicator as Source in the settings (see Source). An Overlay built on a Pane indicator moves to that indicator's pane when you press OK, and onto its scale. Set its Source back to a price and it returns to the price chart. A copy of it you paste lands in its source's pane too. When you move an indicator to another pane, the Overlays built on it go along. A Pane indicator built on another one stays in its own pane.
Indicator settings
Settings has two tabs. Changes preview live on the chart, which stays visible behind the dialog. OK (or Enter in a field) keeps them as one Undo step; Cancel, Esc or a click outside the dialog drops them. Defaults, next to the close button, puts back a new indicator's inputs, colors, style (lines, levels, Background, Output values) and legend name. It removes the levels you added. Cancel still undoes it.
Inputs
One row per input: a number box with Decrease and Increase buttons, a list (like Source or Type), or a tickbox. Most lengths go from 1 to 500. The reference lists each indicator's inputs and defaults.
Under Name, Legend name replaces the legend label (up to 60 characters). Leave it empty to show the default label.
Style
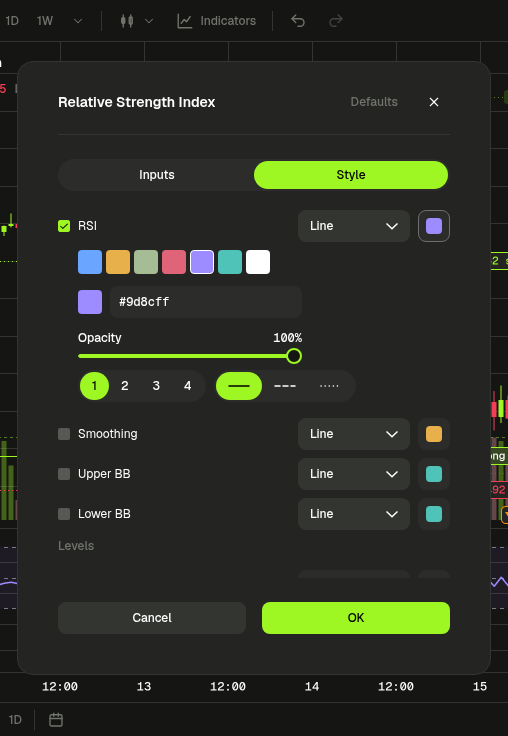
- Lines. Each line has a tickbox: untick it to hide the line. Click its color to pick a color, opacity, thickness (1 to 4) and line style. The button next to it turns on a Price line at the last value and sets the plot type: Line, Line with breaks, Step line, Step line with breaks, Step line with diamonds, Histogram, Cross, Area, Area with breaks, Columns or Circles. Ticking a smoothing line while Smoothing is None turns smoothing on (see Smoothing).
- Levels lists the indicator's own levels, like the RSI's 70, 50 and 30. Show or hide each one, change its value, or click its color for color, opacity, thickness (1 to 4) and line style. Add level adds a gray dashed level at 0, on any indicator. You can remove the levels you added, not the indicator's own: hide those instead.
- Background shades the area between an indicator's outer levels: tick it on or off and set its color. Only nine indicators have it (see Background).
- Output values: Precision (Default, or 0 to 8 decimals) sets the decimals in the legend and on the price axis. Labels on price scale shows or hides the last values there, whatever Indicators value labels says; left untouched, it follows that setting.
Two exceptions: the Up / down volume of the volume profiles has only a color, and Previous Highs & Lows lists no lines here (its colors are on Inputs).
Panes
Drag the line between two panes to resize them. Hover a pane to show its buttons:
| Button | Shows on |
|---|---|
| Move pane up | Every indicator pane but the first (nothing goes above the price chart) |
| Move pane down | Every indicator pane but the last |
| Delete pane | Every indicator pane |
| Collapse pane / Restore pane | Every indicator pane: folds it to its legend line, or unfolds it |
| Maximize pane / Restore pane | Every pane, the price chart included, once the chart has an indicator pane: shows it alone, or brings the others back |
While a pane is maximized, the others are hidden and it shows only Restore pane. Collapsing and maximizing are not saved.
To hide every indicator's legend row, click the small arrow under the market's legend. It then shows how many rows are folded: click it again to show them.
To remove every indicator at once, right-click the chart and pick Remove N indicators.
Reference
Every indicator the picker offers: 22 Trend, 22 Momentum, 10 Volatility, 11 Volume and 1 Liquidity. Inputs show their defaults; list inputs show their choices in brackets. Levels are the guides on the Style tab; Background marks the indicators that can shade between their outer levels. A line marked (histogram), (step) or (dots) starts as Columns, Step line with breaks or Circles.
Trend
| Indicator | Placement | What it shows | Inputs (defaults) | Plots and levels |
|---|---|---|---|---|
| Moving Average | Overlay | Simple average of the last N values | Length 9, Source close | MA |
| Exponential Moving Average | Overlay | Average that weights recent values more | Length 9, Source close | EMA |
| Weighted Moving Average | Overlay | Average of the last N values, weighted more toward recent ones | Length 9, Source close | WMA |
| Hull Moving Average | Overlay | Fast, smooth average built from weighted averages | Length 9, Source close | HMA |
| Double EMA | Overlay | EMA with less lag: twice the EMA minus the EMA of the EMA | Length 9, Source close | DEMA |
| Triple EMA | Overlay | EMA with its lag canceled by three nested EMAs | Length 9, Source close | TEMA |
| Volume Weighted Moving Average | Overlay | Average of the last N values, weighted by volume | Length 20, Source close | VWMA |
| Arnaud Legoux Moving Average | Overlay | Bell-curve-weighted average, tuned between smoothness and lag | Length 9, Offset 0.85, Sigma 6, Source close | ALMA |
| Linear Regression Curve | Overlay | End point of the best-fit straight line through the last N values | Length 9, Offset 0, Source close | LinReg |
| VWAP | Overlay | Volume-weighted average price, restarting every day, week, month or year | Source hlc3, Anchor period day (day, week, month, year) | VWAP |
| Moving Average Ribbon | Overlay | Eight averages of rising length; their spread shows trend strength | Type EMA (EMA, SMA, WMA, HMA), First length 20, Step 5, Source close | MA 1 to MA 8 |
| Supertrend | Overlay | ATR trailing stop that flips with the trend | ATR length 10, Factor 3 | Up (step), Down (step) |
| Parabolic SAR | Overlay | Stop-and-reverse dots that speed up with the trend | Start 0.02, Increment 0.02, Max 0.2 | SAR (dots) |
| Ichimoku Cloud | Overlay | Conversion and base lines, a cloud projected forward, and a lagging close | Conversion line 9, Base line 26, Leading span B 52, Displacement 26 | Conversion, Base, Lagging, Leading A, Leading B |
| ZigZag | Overlay | Joins swing highs and lows that reverse by at least a set percent | Deviation % 5, Depth 10 | ZigZag |
| ADX / DMI | Pane | Trend strength (ADX) with directional movement (+DI and -DI) | DI length 14, ADX smoothing 14 | ADX, +DI, -DI |
| Aroon | Pane | How recently the highest high and the lowest low occurred, 0 to 100 | Length 14 | Up, Down |
| Aroon Oscillator | Pane | Aroon Up minus Aroon Down, -100 to 100 | Length 14 | Osc; level 0 |
| Vortex Indicator | Pane | Upward against downward movement, relative to the true range | Length 14 | VI+, VI- |
| Choppiness Index | Pane | Whether price trends (low) or chops sideways (high), 0 to 100 | Length 14 (2 to 500) | CHOP; levels 61.8, 38.2; Background |
| Previous Highs & Lows | Overlay | High and low of the last closed month, week, day, 4H, 1H and 15m candle | Levels from high/low (high/low, closes, body), a tickbox and color per timeframe | A high and a low per timeframe ticked |
| Pivot Points Standard | Overlay | Support and resistance from the previous period's high, low and close | Type traditional (traditional, classic, fibonacci, camarilla, woodie), Timeframe auto (auto, day, week, month, year) | R3, R2, R1, P, S1, S2, S3 |
Momentum
| Indicator | Placement | What it shows | Inputs (defaults) | Plots and levels |
|---|---|---|---|---|
| Relative Strength Index | Pane | Speed of recent gains against losses, 0 to 100 | Length 14, Source close, Smoothing (length 14) | RSI; levels 70, 50, 30; Background |
| MACD | Pane | Gap between a fast and a slow EMA, with a signal line | Fast length 12, Slow length 26, Signal length 9, Source close | Histogram (histogram), MACD, Signal |
| Stochastic | Pane | Close relative to the recent high-low range | %K length 14, %K smoothing 1, %D smoothing 3, Smoothing (length 14) | %K, %D; levels 80, 20; Background |
| Stochastic RSI | Pane | Stochastic applied to the RSI | RSI length 14, Stochastic length 14, %K 3, %D 3, Source close | %K, %D; levels 80, 20; Background |
| Commodity Channel Index | Pane | Distance of the typical price from its average, in mean deviations | Length 20, Smoothing (length 20) | CCI; levels 100, -100; Background |
| Williams %R | Pane | Close relative to the recent range, 0 to -100 | Length 14 | %R; levels -20, -80; Background |
| Rate of Change | Pane | Percent change over the last N bars | Length 9, Source close | ROC; level 0 |
| Momentum | Pane | Change over the last N bars | Length 10, Source close | Mom; level 0 |
| Awesome Oscillator | Pane | 5-bar minus 34-bar average of the bar midpoint, colored by direction | Fast length 5, Slow length 34 | AO (histogram) |
| Accelerator Oscillator | Pane | Awesome Oscillator minus its 5-bar average, colored by direction | Fast length 5, Slow length 34, Signal length 5 | AC (histogram) |
| TRIX | Pane | Rate of change of a triple-smoothed EMA of the log price | Length 18, Source close | TRIX; level 0 |
| Detrended Price Oscillator | Pane | Price minus a moving average shifted back half its length, to show cycles | Length 21, Centered off, Source close | DPO; level 0 |
| Ultimate Oscillator | Pane | Buying pressure averaged over three windows, 0 to 100 | Fast length 7, Middle length 14, Slow length 28 | UO |
| Fisher Transform | Pane | Where the bar midpoint sits in its range, on a near-normal scale | Length 9 | Fisher, Trigger; levels 1.5, 0.75, 0, -0.75, -1.5 |
| Know Sure Thing | Pane | Weighted sum of four smoothed rates of change | ROC length 1 to 4: 10, 15, 20, 30; SMA length 1 to 4: 10, 10, 10, 15; Signal length 9 | KST, Signal; level 0 |
| Coppock Curve | Pane | Weighted average of a long and a short rate of change | WMA length 10, Long ROC length 14, Short ROC length 11, Source close | Coppock |
| True Strength Index | Pane | Double-smoothed momentum over its absolute value, -100 to 100 | Long length 25, Short length 13, Signal length 13, Source close | TSI, Signal; level 0 |
| SMI Ergodic | Pane | True strength ratio with a signal line; the histogram is their gap | Long length 20, Short length 5, Signal length 5, Source close | Oscillator (histogram), SMI, Signal |
| Connors RSI | Pane | Average of a short RSI, the RSI of the up/down streak, and the rank of the last change | RSI length 3, Streak RSI length 2, Percent rank length 100 | CRSI; levels 70, 30; Background |
| Relative Vigor Index | Pane | Close minus open against the bar range, smoothed, with a signal line | Length 10 | RVGI, Signal |
| Balance of Power | Pane | Close minus open over the bar range, -1 to 1 | None | BOP (histogram) |
| Elder Ray | Pane | Bull power (high minus EMA) and bear power (low minus EMA) | Length 13 | Bull, Bear; level 0 |
Volatility
| Indicator | Placement | What it shows | Inputs (defaults) | Plots and levels |
|---|---|---|---|---|
| Bollinger Bands | Overlay | Moving average with bands N standard deviations away | Length 20, StdDev 2, Source close | Basis, Upper, Lower; shaded between bands |
| Keltner Channels | Overlay | EMA with bands a multiple of the true range's EMA away | Length 20, Multiplier 1 | Basis, Upper, Lower; shaded between bands |
| Donchian Channels | Overlay | Highest high and lowest low of the last N bars | Length 20 | Upper, Basis, Lower; shaded between bands |
| Envelope | Overlay | Moving average with bands a fixed percent above and below | Length 20, Percent 10, Type SMA (SMA, EMA, WMA), Source close | Basis, Upper, Lower; shaded between bands |
| Chandelier Exit | Overlay | ATR trailing stop hung from the highest high (long) or the lowest low (short) | ATR period 22, ATR multiplier 3, Extremes from high/low (close, high/low) | Long stop (step), Short stop (step) |
| Average True Range | Pane | Wilder's average of the true range | Length 14 | ATR |
| Mass Index | Pane | Sum of the ratio of two range EMAs; spikes flag reversals | Sum length 10, EMA length 9 | MI |
| Bollinger Bands %B | Pane | Where price sits between the Bollinger Bands: 0 at the lower, 1 at the upper | Length 20, StdDev 2, Source close | %B; levels 1, 0; Background |
| Bollinger BandWidth | Pane | Width of the Bollinger Bands relative to the basis | Length 20, StdDev 2, Source close | BBW |
| Historical Volatility | Pane | Annualized standard deviation of log returns, in percent | Length 10, Bars per year (0: auto) 0 | HV |
Volume
| Indicator | Placement | What it shows | Inputs (defaults) | Plots and levels |
|---|---|---|---|---|
| Volume | Pane | Traded volume per bar, colored by bar direction, with its average | MA length 20 | Volume (histogram), MA |
| On-Balance Volume | Pane | Running total of volume, signed by the direction of the close | None | OBV |
| Money Flow Index | Pane | Volume-weighted RSI of the typical price | Length 14, Smoothing (length 14) | MFI; levels 80, 20; Background |
| Chaikin Money Flow | Pane | Accumulation against distribution over N bars | Length 20 | CMF (histogram); level 0 |
| Accumulation/Distribution | Pane | Running total of volume, weighted by where each close sits in its range | None | A/D |
| Chaikin Oscillator | Pane | Fast minus slow EMA of Accumulation/Distribution | Fast length 3, Slow length 10 | Osc; level 0 |
| Price Volume Trend | Pane | Running total of volume times the percent change of the close | None | PVT |
| Ease of Movement | Pane | How easily price moves: midpoint change times range, per unit of volume | Length 14, Divisor 10000 | EOM |
| Elder Force Index | Pane | EMA of the price change times volume | Length 13 | EFI; level 0 |
| Visible Range Volume Profile | Overlay | Volume at each price over the bars on screen | Rows 24, Value area % 70, Width % 30 | Up / down volume, POC |
| Session Volume Profile | Overlay | Volume at each price for each session, drawn from its first bar | Session auto (auto, day, week, month), Rows 24, Value area % 70, Width % 60 | Up / down volume, POC |
Liquidity
| Indicator | Placement | What it shows | Inputs (defaults) | Plots and levels |
|---|---|---|---|---|
| Liquidation Heatmap (model) | Overlay | Estimated liquidation clusters, from volume and common leverage | Half-life (bars) 3, Show top % 20, Bucket size % 0.25 | A heatmap, no lines |
Special cases
Source
The Source list offers eight prices: close, open, high, low, hl2 (high and low averaged), hlc3 (high, low and close averaged), ohlc4 (open, high, low and close averaged) and volume. Under an Indicators heading, it then lists every line of the other indicators on the chart, by their legend name, followed by the line's name when the indicator has several (for example MACD 12 26 9 close: Signal). Indicators already built on this one are left out, and so are the volume profiles.
25 indicators have a Source: the nine averages from Moving Average to Linear Regression Curve, VWAP, Moving Average Ribbon, Relative Strength Index, MACD, Stochastic RSI, Rate of Change, Momentum, TRIX, Detrended Price Oscillator, Coppock Curve, True Strength Index, SMI Ergodic, Bollinger Bands, Envelope, Bollinger Bands %B and Bollinger BandWidth. The source defaults to close, except on VWAP (hlc3).
Smoothing
Relative Strength Index, Stochastic, Commodity Channel Index and Money Flow Index share three inputs that add an average over the main line:
| Input | Default | Choices |
|---|---|---|
| Smoothing | None | None, SMA, EMA, RMA, WMA, SMA + BB |
| Smoothing length | 14 (20 on the CCI) | 1 to 500 |
| BB StdDev | 2 | 0.1 to 10, used by SMA + BB only |
Any choice but None draws a Smoothing line. SMA + BB also draws Upper BB and Lower BB, with a light fixed shading between them.
Previous Highs & Lows
It draws the high and the low of the last closed candle of each timeframe you tick, as flat lines from the bar that made them to the right edge, with a tag at their end (PMH and PML for the month, PWH/PWL, PDH/PDL, 4H H/4H L, 1H H/1H L, 15m H/15m L).
- Levels from: high/low (the wicks, default), closes (the highest and lowest close in the candle) or body (open to close).
- Previous month, Previous week, Previous day, Previous 4H, Previous 1H and Previous 15m: a tickbox and a color each. Week, day and 4H are on at first.
- Months, weeks, days and hours count in UTC.
- A timeframe draws nothing when the chart's bars are as long as it or longer, like Previous day or Previous 4H on a 1D chart.
- The lines have no Style entries and no labels on the price axis, and they never rescale the chart: lines out of view are cut off.
Pivot Points Standard
- Type: traditional (default), classic, fibonacci, camarilla or woodie.
- Timeframe: the period whose high, low and close make the levels: day, week, month, year, or auto (default): day on charts of 15 minutes or less, week below 1D, month below 1W, year on 1W and longer.
- It draws P and three levels each side, R1 to R3 and S1 to S3, for each period. Periods count in UTC.
VWAP
Anchor period (day by default, or week, month, year) sets when the average restarts: at the start of each period, in UTC. Its Source is hlc3 by default.
Volume profiles
Both draw horizontal bars of up and down volume at each price, with a POC line at the price that traded the most. The value area grows from the POC one row at a time and stops before the row that would take it past Value area %, so it holds up to that share of the volume. Bars outside it are fainter.
| Input | Visible Range Volume Profile | Session Volume Profile |
|---|---|---|
| What it covers | The bars on screen; it updates as you scroll | Each session, in UTC, from its first bar |
| Session | None | auto (default): day up to 1H bars, week below 1D, month on 1D and longer; or day, week, month |
| Rows | 24 | 24 |
| Value area % | 70: the largest share of volume the value area holds | 70 |
| Width % | 30, of the chart's width, from the right edge | 60, of the session's width |
On the Style tab, Up / down volume has only a color, which sets the up volume. The down volume keeps the chart's down color. POC is a line like any other.
Moving Average Ribbon
Eight averages of the chosen Type, lengths starting at First length and growing by Step: 20, 25, 30 and so on up to 55 by default.
Ichimoku Cloud
Leading A and Leading B are shifted Displacement minus one bars ahead (25 by default), so the cloud between them runs into the empty space right of the last bar. Lagging is the close shifted as many bars back. The cloud is shaded in the chart's up color where Leading A is above Leading B, in its down color where it is below. This shading is fixed: it has no setting.
Liquidation Heatmap (model)
It is an estimate of where liquidations cluster, built from volume and common leverage levels. It is not exchange data: no real positions or orders go into it. Each closed bar's traded value is spread over leverage tiers from 5× to 100×, long and short, at the prices those positions would be liquidated. A cluster ends when price trades through it, or once it has faded. The heatmap draws under the candles and does not rescale the chart.
| Input | Default | What it does |
|---|---|---|
| Half-life (bars) | 3 | How many bars it takes a cluster to fade by half |
| Show top % | 20 | The share of clusters shown, the largest first |
| Bucket size % | 0.25 | The price height of a cluster, as a percent of price |
Background
Background is on the Style tab of nine indicators only: Choppiness Index, Relative Strength Index, Stochastic, Stochastic RSI, Commodity Channel Index, Williams %R, Connors RSI, Bollinger Bands %B and Money Flow Index. It shades between their first and last own level.
The shading of Bollinger Bands, Keltner Channels, Donchian Channels, Envelope, the Ichimoku cloud and the SMA + BB smoothing band is fixed: it has no setting.
Legend labels
By default, the legend row shows the short name followed by the values of the inputs, for example RSI 14 close or BB 20 2 close. Some inputs are left out: the Smoothing inputs, Anchor period on VWAP, Centered on the Detrended Price Oscillator, Bars per year on Historical Volatility, and Value area % and Width % on the volume profiles. Previous Highs & Lows and the Liquidation Heatmap (model) show their name only. An indicator built on another one shows that one's label in brackets, for example MA 9 (RSI 14 close). A Legend name you set replaces the whole label.