Chart
Read the market, draw your analysis and manage your trades on the LN Markets chart
Overview
The chart sits in the middle of the trading screen. It shows the market's candles and your running trades. You can add indicators and drawings to it, and it saves your setup for each market.
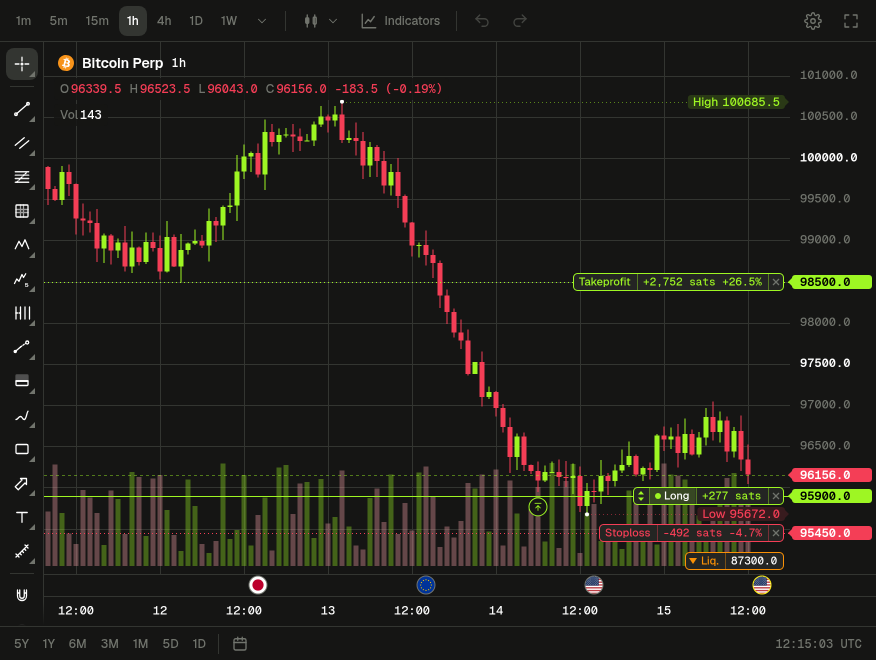
The top bar holds the timeframes, the chart style, Indicators, Undo and Redo, Chart settings, Screenshot and, where the browser supports it, Fullscreen. The drawing tools are in the column on the left. The bar under the chart holds the date ranges, Go to, the market sessions and the clock.
This page covers the chart itself. The other chart pages cover:
- Indicators: adding, setting up and arranging indicators, and what each one draws.
- Drawing tools: every drawing tool, and how to edit drawings.
- Trading on the chart: your positions and orders on the chart, editing them from it, and economic events.
- Shortcuts and menus: the keyboard shortcuts and the right-click menus.
On a Mac, use ⌘ for Ctrl and ⌥ for Alt.
Choosing your chart
LN Markets offers two charts: TradingView, shown by default, and Original, the LN Markets chart these pages describe.
To switch, pick TradingView or Original in the menu to the right of the Chart tab. On a phone, the gear at the top right opens the settings page: pick it under Chart library.
The choice is saved in your browser, so each device keeps its own.
Timeframes
Click a timeframe button (1m, 5m, 15m, 1h, 4h, 1D, 1W by default) to change the candle size. The arrow next to them (More intervals) lists every timeframe: 1m, 3m, 5m, 10m, 15m, 30m, 45m, 1h, 2h, 3h, 4h, 1D, 1W, 1M and 3M. A lowercase m means minutes and an uppercase M means months. When you pick a timeframe that has no button, the arrow shows its name, highlighted.
You can also type a timeframe. With the chart focused, type a digit from 1 to 9 to open Change interval, add a unit (H for hours, D for days, W for weeks, M for months, nothing for minutes) and press Enter. For example, 4H sets 4 hours and 15 sets 15 minutes. What you type is shown in capitals, so 4h works too, but 5m reads as 5M, 5 months: for 5 minutes, type 5. Under what you type, the box shows the timeframe it reads, or Not applicable when the chart has no such timeframe. Press , to open the box with the current timeframe selected. Esc closes it without a change.
The chart opens on 1h. Each market remembers the last timeframe you used.
Favorite timeframes. The buttons in the top bar are your favorite timeframes. Each time it opens, the chart takes them from the timeframes you starred on the TradingView chart in this browser, in the order that chart keeps them. When none are starred, it shows the default seven. When every timeframe is a favorite, there is no arrow. You can't change them on the Original chart: switch to the TradingView chart, add or remove favorites in its timeframe menu, then switch back.
Chart styles
Click the chart-style button to choose how bars are drawn. Its icon shows the family of the style you picked: candles, bars, a line or an area.
| Style | What it draws |
|---|---|
| Candles | A body from the open to the close and wicks to the high and low, in the up color when the close is at or above the open |
| Hollow candles | Candles colored by the close against the previous close, with the body left open when the close is above the open |
| Heikin Ashi | Candles of averaged prices, which smooth out the moves |
| Bars | A bar from the high to the low, with the open as a tick on the left and the close on the right |
| Columns | A column from the bottom of the pane up to the close, colored by the close against the previous close |
| High-low | A bar from the high to the low, without ticks |
| Line | The closes joined by a line |
| Step line | The closes as steps |
| Area | The close line, filled below |
| Baseline | The close line and its fill, in the up color above the middle of the price pane and the down color below |
| HLC area | The close line, with the band up to the highs in the up color and the band down to the lows in the down color |
Volume, on by default, adds volume columns along the bottom of the price pane under any style. Turn it off, and change the up and down colors, in Chart settings → Symbol.
Moving around
| To | Do this |
|---|---|
| Scroll back in time | Drag the chart left or right, or use the trackpad sideways |
| Zoom in or out | Use the mouse wheel, or pinch on a trackpad |
| Stretch or squeeze the bars | Drag the time axis at the bottom |
| Scale the price axis | Drag the price axis up or down, or use the wheel over it |
| Go back to the latest bar | Click » at the bottom right of the chart |
| Reset the view | Double-click the time axis, or right-click and pick Reset chart view |
Zooming with the wheel keeps the right edge of the chart in place, so the latest bars stay where they are. Bars are between 0.5 and 64 pixels wide, 7 by default. Dragging the price axis or using the wheel over it turns Auto scale off (see Price scale).
Older candles load as you scroll back. When you move the pointer near the bottom of the chart, buttons appear to zoom, scroll and reset. » shows only when the latest bar is off screen. For the keys that scroll and zoom, see Shortcuts and menus.
Resetting the view returns to the latest bars at the default zoom and turns Auto scale back on, which also unlocks Lock price to bar ratio. It keeps your other price scale settings.
Date ranges and Go to
The bar under the chart starts with date ranges. Each one sets a timeframe and shows that much history, up to the latest bar, if the chart is wide enough for it. Bars are at least 0.5 pixels wide, so on a narrower chart a range shows as much of its period as fits: 6M, for example, needs a plot about 1,100 pixels wide.
| Range | Timeframe |
|---|---|
| 5Y | 1W |
| 1Y | 1W |
| 6M | 2h |
| 3M | 1h |
| 1M | 30m |
| 5D | 5m |
| 1D | 1m |
Older candles load first when the range needs them. If the market has less history than the range, the chart shows it from the first candle.
To go to a date, click the calendar button next to the ranges, or press Alt+G with the chart focused. Go to opens on its Date tab, on today. Pick a date and, on timeframes under a day, a time (00:00 by default), then click Go to or press Enter. On 1D and longer, the Time field stays grayed out at 00:00. The chart centers that bar at the current zoom, loading older candles if needed. A date before the first candle shows the start of the history. The date and time are in the chart's time zone, except on 1D and longer, where they are in UTC.
To show a stretch of time instead, pick the Custom range tab. From and To start on the range on screen: set a date and, under a day, a time for each, then click Go to. The chart shows the bars from the first to the end of the last, loading older candles if needed. To can't be before From. Until you reload or change market, Go to opens on the tab you used last.
The clock at the right of the bar shows the time now in the chart's time zone and its offset from UTC, for example 14:05:09 UTC+2. Click it to pick another time zone: UTC, your local time or one of 14 cities. It is the same setting as Chart settings → Time, and it is saved with the layout.
Left of the clock, the market sessions show the next market to open or close among New York, London, Tokyo and CME Globex, for example LDN closes 58m, with a bar of how far that market's session has run. Hover them, or click, for the time now and each market's day: its open hours on a track of the chart's day, and the time until it opens or closes, in each market's own hours and daylight saving time, without holidays.
Price scale
The price axis fits the visible candles while Auto scale is on. Dragging the price axis turns it off and lets you set the range yourself. Double-click the price axis to turn Auto scale back on. With Auto scale off, dragging the chart also moves the prices up and down, and the chart keeps your range when you come back.
Right-click the price axis of the price chart for its menu:
- Auto (fits data to screen): turns Auto scale on or off.
- Lock price to bar ratio: freezes the ratio between the price range and the bar width (the number shown next to it) and turns Auto scale off. Zoom the bars and the prices zoom with them; drag the price axis and the new range becomes the ratio. While it is locked, the menu's Auto and scale modes are grayed out. Turning Auto scale back on (double-click the price axis, or use the chart's right-click menu) unlocks it.
- Scale price chart only: Auto scale fits the candles alone, not the indicators drawn over them.
- Invert scale: the axis upside down.
- Regular, Percent (prices as a percentage change from the first visible bar), Indexed to 100 and Logarithmic (equal distances for equal percentage moves).
- Move scale to left / Move scale to right: puts the price axes of every pane on that side.
- Labels: shows or hides the labels on the axis: Symbol last price label, High and low, Indicators value labels (off by default) and Countdown to bar close. No overlapping labels moves labels apart when they would overlap: turn it off to keep each at its price.
- High and low, in Labels (on by default), marks the highest and lowest price in view: a dot on its bar, a faint dotted line from that bar to a High or Low label against the axis. One switch shows or hides all three.
- Lines: Price line (the line across the chart at the last price).
- More settings…: opens Chart settings on Scales.
Right-clicking the chart itself also offers Log scale, Percent scale, Invert scale and Auto scale. While the ratio is locked, Log scale and Percent scale are grayed out there, and Alt+L and Alt+P do nothing. The rest of that menu is in Shortcuts and menus.
Crosshair and legend
Move the pointer over the chart to see the crosshair, with the price on the right axis and the date on the bottom axis. Its color is in Chart settings → Appearance.
The legend at the top left shows the market and timeframe, then the open (O), high (H), low (L) and close (C) of the bar under the crosshair, its change from the previous close, and its volume (Vol). Vol is left out when Volume is off in Chart settings, or when the market has no volume. When the pointer is off the chart, the legend shows the latest bar.
Each indicator adds a row under it: see Indicators. To fold every indicator row away, click the small arrow under the market's legend (Hide indicators legend). It then shows how many rows are folded: click it again to show them. On a narrow chart, as on most phones, the legend starts folded to the market and timeframe: the arrow (Show legend) shows the bar's values and the indicator rows. Folding is not saved.
Undo and redo
Use Undo and Redo in the top bar, or Ctrl+Z and Ctrl+Shift+Z (Ctrl+Y also redoes).
Undo covers:
- Drawings: adding, moving, styling, editing, cloning, pasting, reordering, locking, hiding one, removing, Lock all drawings, Show N hidden drawings and Remove N drawings. Each OK in a drawing's settings is one step.
- Indicators: adding, removing, settings, hiding, cloning, Visual order, Move to another pane, Pin to scale, moving or deleting a pane, and Remove N indicators. Removing an indicator's pane also removes the drawings on it, and Undo brings both back.
While you place or drag a drawing, Undo cancels it instead.
Undo does not cover the timeframe, the chart style, the price scale, Chart settings, Hide drawings (every drawing at once), collapsing or maximizing a pane, or folding the legend.
The chart keeps the last 100 steps. The history starts empty each time the chart opens.
Chart settings
Click the gear in the top bar to open Chart settings on Symbol. More settings… in the price scale menu opens it on Scales. Switches turn settings on and off; a color's button opens its palette under it, with its hex code to type any other color.
| Tab | Settings |
|---|---|
| Symbol | Chart type (the bar style), Up color, Down color, Volume (on by default), Countdown to bar close (off by default) |
| Scales | Scale (Regular, Logarithmic, Percent, Indexed to 100), Invert scale, Auto scale, High and low (on by default), Swing callouts (off by default), Indicators value labels (off by default) |
| Appearance | Background, Grid lines, Crosshair |
| Time | Time zone (UTC by default), also set from the clock under the chart |
| Trading | The lines of your positions and orders, editing them from the chart, and economic events: see Trading on the chart |
Swing callouts marks the main swing highs and lows in view, each with a box giving its % move from the swing before. A bar counts as a swing when it is the highest or lowest of the 6 bars on each side, and small moves between swings are skipped. Bars near the left and right edges of the view get no callout, and with fewer than about 30 bars in view there are none.
Changes on Symbol, Scales, Appearance and Time preview live on the chart, which stays visible behind the dialog. Trading applies only when you click Validate. Validate (or Enter in a field) keeps your changes. Cancel, Esc, the close button or a click outside the dialog drops them, and puts the price scale back as it was. There is no button to restore the defaults.
The first four tabs are saved with the market's layout. Trading is kept in this browser and applies to every market.
Screenshots and fullscreen
Screenshot offers Download image (Ctrl+Alt+S) and Share image (Ctrl+Alt+↑). Share image shows the chart image and where to share it: X, Telegram, WhatsApp, Reddit, Discord or Email. A link cannot carry an image, so each one copies the image for you to paste into your post; X, Telegram, WhatsApp and Email also open a new post with a link to the page.
Right-click the chart and pick Copy chart image (Ctrl+Shift+S) or Download chart image (Ctrl+Alt+S). The image shows the chart without the crosshair, with the market and timeframe, the open, high, low and close of the latest bar, and the date and time in the chart's time zone. The download is named chart- followed by the date and time in UTC, for example chart-2026-10-01-14-05-09.png. When the browser refuses the copy, the message Could not copy the image says so.
Fullscreen in the top bar fills the screen with the chart, its top bar, drawing column and bottom bar. Click Exit fullscreen or press Esc to leave. Browsers without fullscreen, as on an iPhone, have no Fullscreen button.
Layouts
The chart saves your setup for each market:
- The timeframe and chart style.
- Indicators with their settings, the panes and their heights.
- Drawings, hidden and locked ones included, favorite tools, the magnet and Stay in drawing mode.
- The price scale: its mode, Invert scale, the range you set with Auto scale off, Lock price to bar ratio, Scale price chart only, its side, and its labels and lines.
- Chart settings, except Trading: colors, Volume, the countdown, High and low, Swing callouts and the time zone.
The zoom and scroll position, collapsed or maximized panes, the folded legend and the undo history are not saved. Chart settings → Trading is kept in this browser for every market, not in the layout.
Each market has its own layout. It is saved to your account, so it follows you to other devices. A drawing you add, move, change or remove is saved at once. Other changes are saved a moment after you make them, and at once when you leave or hide the page. Press Ctrl+S to save at once. What you preview in Chart settings or an indicator's settings is saved when you click OK.
A chart open in another tab or on another device picks up your changes when you come back to it, before your next change there, once you are not dragging anything and have no menu or dialog open. If two tabs change the same layout before one has picked up the other's changes, the drawings of both are kept; a drawing changed in both keeps the version saved last. The indicators, pane heights and other settings come from the tab that changed them, or from the one that saved last when both did.
If a save fails, the message Your chart layout could not be saved shows once, until saving works again. The chart tries again up to six times, waiting longer each time, and saves again with your next change.
If the layout was saved by a newer version of the chart, for example in another tab after an update, the chart says This chart was saved by a newer version: changes made here are not saved. Reload the page. Until you reload, your changes in that tab are not saved, and the stored layout is not overwritten.
Layouts are saved only when you are signed in. Signed out, your changes last until the chart reloads: when you reload the page, change market or language, sign in, switch chart library, or resize the window across the phone layout.
Importing your TradingView layout. The Original chart never takes your TradingView layouts by itself: a market you haven't set up opens with a fresh chart. To bring one in, sign in, open Chart settings and click Import from TradingView. Pick one of the layouts you saved on the TradingView chart of this market (the newest is picked), and whether to bring your TradingView chart settings too. Importing replaces this market's chart, after you confirm: it can't be undone. You can import again at any time.
It converts the chart style, price scale (with Scale price chart only), time zone, timeframe, the chart settings you changed (grid turned off, countdown, price labels and lines, high and low lines, scale side; not the chart colors, which keep the app's), indicators (with their inputs and colors) and drawings (with their points, color, text, levels and lock). It also keeps line widths and styles, fills, text colors, trend line extensions, text size, bold, italic and alignment, the timeframes a drawing shows on, and indicator styles (line types, levels, background). Indicators and drawing tools that have no equivalent are left out, as are the colors of Fibonacci and Gann levels. When some are left out, a notice names them. Your TradingView layout stays as it was, and you can still use it on the TradingView chart.
Importing your TradingView settings. With Chart settings on, the import also takes what the TradingView chart kept in this browser: the chart style and chart settings it opened new charts with, your favorite drawing tools, the magnet and Stay in drawing mode. The favorite tools, magnet and Stay in drawing mode go in this market's layout. The chart style and settings are saved to your account: every market you haven't set up opens with them. TradingView's templates, its default styles of drawing tools and indicators, and its favorite indicators and chart styles are not taken: the Original chart has none of them.
On a phone
On a phone, tap Markets in the bottom bar: the chart is in its Chart tab, at its full height. Market depth and News feed are below it.
The top bar is compact: the timeframe button (1h ▾, which lists every timeframe), the chart style, Indicators, and ⋯ with Undo, Redo, Chart settings and Fullscreen. The legend folds the indicators into one line (2 indicators): tap it to unfold them, then tap an indicator's row to show its buttons. More opens its menu.
- Drag with one finger to scroll, pinch to zoom. After a quick swipe, the chart keeps scrolling for a moment.
- Hold your finger still for about 0.7 s to show the crosshair and the legend of a bar, then move it to follow the bars.
- Hold your finger still for about a third of a second, then draw: a straight stroke becomes a Horizontal Line, a Vertical Line or a Trend Line, any other a Brush stroke (see Draw by hand in Drawing tools).
- Double-tap the price axis to turn Auto scale back on, or the time axis to reset the view.
Drawing tools. Tap the pen at the bottom left of the chart to open the drawing tools, pick one, then tap the chart to place its points. While a tool is picked the pen shows it: tap it to stop drawing. Drag a drawing with your finger to move it, or drag one of its points to reshape it, unless it is locked. Double-tap a drawing to open its settings, where you can remove it. On a text drawing, double-tap edits the text.
Trading. Trade lines and fill markers show as on a computer. Drag a takeprofit or stoploss line with your finger to move it: on a phone, every edit asks first. A label pinned to the top or bottom edge, for a line out of view, still brings the line into view when you tap it.
Economic events sit over the bottom of the chart: tap a badge to read it. The bar under the chart keeps its date ranges and Go to, without the market sessions and the clock. There is no right-click menu on touch screens: use Chart settings for the price scale, and the More button of an indicator's legend row for its menu.
The TradingView chart has its own drawing toolbar on phones. It shows none of your trades, on a phone or a computer: trading on the chart is only on the Original chart.